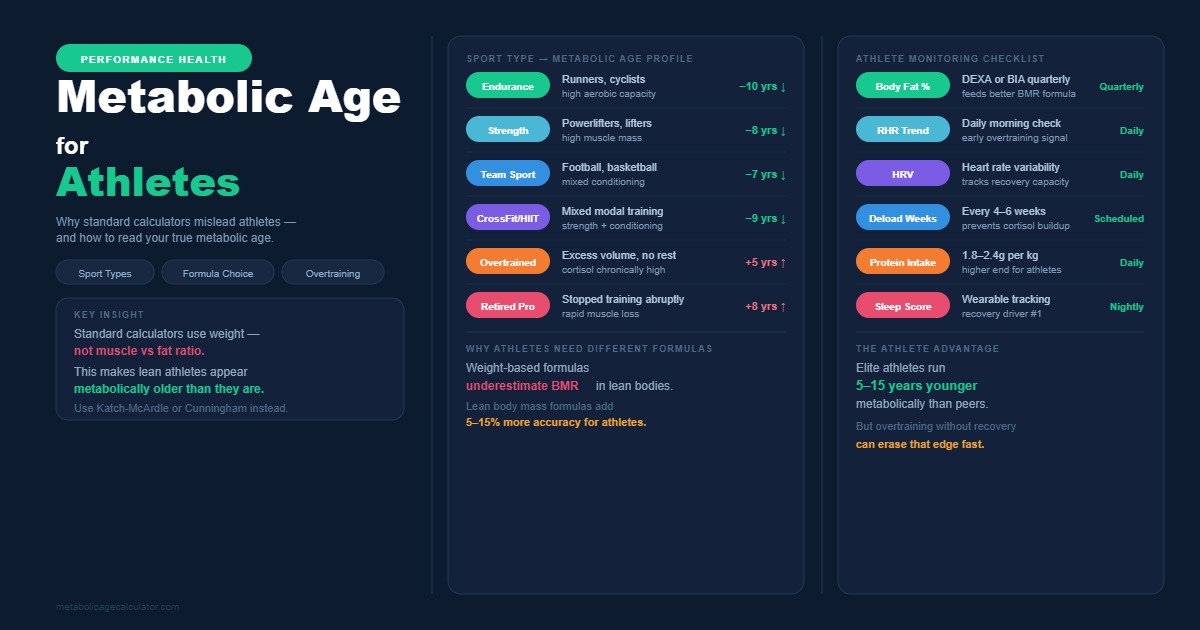
A high metabolic age in athletes usually signals a measurement problem, not a fitness problem. Muscle tissue, stored glycogen, and hydration levels in trained bodies confuse standard Bioelectrical Impedance Analysis (BIA) formulas, producing scores that clash with an athlete's actual condition in 2026.
Three separate causes explain most surprising results: scale measurement error, chronic underfueling, and sport-specific muscle patterns. Each cause changes the number differently, and each needs a different fix. This guide breaks down all three causes and shows you how to get a reading you can trust.
What Causes a High Metabolic Age in Athletes?
Three factors drive a high metabolic age score in athletes: measurement error, chronic underfueling, and sport-specific muscle distribution.
Measurement error explains most surprising scores. Standard BIA scales assume typical fat-to-muscle ratios for your age and sex group. Runners, cyclists, swimmers, and rowers carry 15-25% more muscle mass than sedentary people the same age, which confuses that assumption.
Chronic underfueling raises metabolic age for real reasons. Athletes in weight-sensitive sports such as gymnastics, distance running, and boxing sometimes eat below their training energy needs for weeks at a time. This pattern, called Relative Energy Deficiency in Sport (RED-S), genuinely slows resting metabolism rather than just misreading it.
Sport-specific muscle patterns shift your baseline reading. A powerlifter, a marathoner, and a swimmer build muscle in different proportions, and each pattern produces a different result on a standard scale. Genetics and your testing time of day add smaller effects on top of these three main causes.
You need to identify which of the three main causes applies to your situation before you can fix your number with confidence. A single high reading rarely means anything on its own. Three consecutive readings taken under identical conditions give you a trend worth acting on, while one isolated number usually reflects normal day-to-day water and glycogen fluctuation.
Why Do Smart Scales Misread Athletic Bodies?
Smart scales misread athletic bodies because Bioelectrical Impedance Analysis (BIA) cannot separate muscle mass from water content. Athletes carry 5-10% more water inside muscle tissue than sedentary people at the same weight, and that extra water skews the electrical reading.
How Bioelectrical Impedance Analysis Confuses Muscle and Water
To understand this error, look at how the device works. A small electrical current passes through your feet or hands, and the scale times how fast the current travels. Muscle conducts electricity faster than fat because muscle holds more water. Athletes store three grams of water for every gram of stored glycogen, adding significant water weight inside muscle tissue. A standard scale reads that extra water as unusual and can miscalculate lean mass by 5-8 pounds (2.3-3.6 kg) in heavily trained bodies. This miscalculation pushes the final metabolic age score higher than your true metabolic condition.
How to Switch Your Scale to Athlete Mode
To switch your scale to athlete mode, open the companion app settings and select the athlete or trained-user profile before your next weigh-in. This mode applies a different formula that expects higher muscle mass and a lower resting heart rate. Popular brands including Withings, Garmin, and Renpho include this toggle inside their app settings menu. Skipping this single step remains the most common reason fit people see an inflated metabolic age result.
Can Relative Energy Deficiency in Sport Raise Your Metabolic Age?
Yes, Relative Energy Deficiency in Sport (RED-S) raises metabolic age by suppressing thyroid hormone output and resting energy expenditure. Unlike a scale error, this cause reflects a genuine metabolic slowdown inside your body.
RED-S develops when training energy expenditure exceeds dietary energy intake for several weeks or months. Your body responds by lowering triiodothyronine (T3) production, cutting resting metabolic rate by 5-15% to conserve available fuel. Female athletes in aesthetic and endurance sports such as gymnastics, figure skating, and long-distance running face the highest documented risk. Male cyclists, runners, and rowers develop RED-S too, though research on male athletes remains newer.
3 Warning Signs of RED-S in Athletes
Three warning signs point toward RED-S rather than a simple scale error.
- Missed or irregular menstrual cycles for three consecutive months in female athletes
- Recurring stress fractures or slow-healing injuries despite a normal training load
- Persistent fatigue and cold intolerance that rest days fail to resolve
You should see a sports medicine physician if two or more of these signs appear alongside a rising metabolic age score. Blood tests for thyroid function and estrogen levels can confirm the diagnosis quickly.
How Does Muscle Mass Actually Affect Your Metabolic Age Result?
Muscle mass lowers your metabolic age because muscle tissue burns roughly three times more energy at rest than fat tissue. One kilogram of muscle burns approximately 13 kilocalories daily, compared to 4.5 kilocalories for one kilogram of fat.
Why Muscle Burns More Calories Than Fat
To see why this gap exists, compare two tissues of equal weight. Muscle contains mitochondria, cell structures that convert nutrients into usable energy around the clock. Fat tissue stores energy but performs almost no active metabolic work at rest. Ten extra pounds (4.5 kg) of muscle raises daily Basal Metabolic Rate (BMR) by 60-100 calories. That shift alone can move a metabolic age score by several years in either direction.
Why Two Athletes With the Same Weight Get Different Scores
Two athletes weighing 160 pounds (72.5 kg) can show metabolic ages 10 years apart from each other. A sprinter carrying 18% body fat and dense fast-twitch muscle burns more calories at rest than a cyclist carrying 22% body fat on a lighter frame. Body fat percentage, not total body weight, drives the gap between these two scores. Checking your result with a body fat percentage calculator gives you the full picture before you draw conclusions from weight alone.
Why Do Male and Female Athletes See Different Metabolic Age Patterns?
Male and female athletes see different metabolic age patterns because of baseline differences in muscle mass, essential body fat, and hormone cycles.
Men carry 30-40% more muscle mass than women on average, which raises baseline Basal Metabolic Rate (BMR) independent of training status. Women carry 6-11% more essential body fat than men, tissue needed for hormone production and reproductive function. Estrogen decline between ages 35-45 slows fat metabolism by up to 15%, an effect that training cannot fully offset. Menopause can drop BMR by an additional 200-300 calories daily, even in athletes who maintain heavy training loads. Male athletes see testosterone decline roughly 1% per year after age 30, with a matching drop in resting energy needs. Both sexes benefit from tracking body fat percentage alongside weight, since that number explains most of the score difference between training partners of different sexes.
How to Get an Accurate Metabolic Age Reading as an Athlete
To get an accurate metabolic age reading as an athlete, test in a fasted, hydrated state first thing every morning. Weigh in before eating, drinking coffee, or training, since food and caffeine shift water balance for 2-4 hours afterward. Add your body fat percentage to the calculation for a Katch-McArdle formula result, a method that accounts for lean mass directly instead of estimating it from age and sex alone.
Recalculate your intake with a calorie deficit calculator if your metabolic age climbs during a cutting phase, since underfueling often explains sudden jumps. Repeat the full test every 90 days rather than daily, since muscle takes 8-12 weeks to measurably shift Basal Metabolic Rate (BMR). Keep one method, one time of day, and one device constant across every single test.
Do Endurance Athletes and Strength Athletes Show Different Results?
Yes, endurance athletes and strength athletes show different metabolic age patterns because they build different muscle fiber types and carry different water levels.
How Endurance Athletes' Results Differ
Endurance athletes such as marathon runners, triathletes, and cyclists build slow-twitch muscle fiber with high mitochondrial density. This fiber type burns fat efficiently during long efforts but adds less bulk than fast-twitch fiber. Distance runners sometimes show a metabolic age close to their chronological age despite elite fitness. Low body fat and lighter total muscle mass offset each other in the final calculation.
How Strength Athletes' Results Differ
Strength athletes such as powerlifters, sprinters, and rugby players build fast-twitch muscle fiber with lower mitochondrial density but far greater total mass. This extra muscle volume raises resting energy needs directly and consistently. A 220-pound (100 kg) powerlifter carrying 12% body fat commonly scores a metabolic age 10-15 years below chronological age. Total muscle volume, more than muscle fiber type alone, drives this particular advantage.
How Does Age Interact With Training Status in Athletes?
Training status changes how quickly metabolic age rises with chronological age. Sedentary adults lose 3-8% of muscle mass per decade after age 30, and that loss drives most of the increase in metabolic age over time.
Athletes who maintain 3-4 resistance sessions per week can cut that decade-over-decade muscle loss by roughly half. A 45-year-old competitive triathlete commonly posts a metabolic age 8-12 years below a sedentary peer of the same chronological age. Training status matters more than the calendar in nearly every documented case. Masters athletes over age 50 still show measurable benefits from resistance work, even though absolute muscle-building slows compared to athletes in their 20s. Consistency across decades, not a single training block, produces the largest and most durable gap between metabolic age and chronological age.
Quick Reference: Fixing a Misleading Metabolic Age Score
Use this quick-reference table to fix a misleading score in the correct order. Start with the free steps before booking a clinical scan or consultation. Pair these fixes with a macro calculator tool to confirm your protein and calorie targets support an accurate result.
|
Task |
Timing |
Method |
Difficulty |
|
Switch to athlete mode |
Before every weigh-in |
Device settings menu |
Easy |
|
Add body fat percentage |
Once, recheck monthly |
Body fat calculator or calipers |
Easy |
|
Test fasted and hydrated |
Every morning |
Weigh before food, water, training |
Easy |
|
Recalculate with Katch-McArdle |
Every 90 days |
Manual formula or calculator tool |
Moderate |
|
Screen for RED-S symptoms |
Ongoing |
Sports medicine consultation |
Moderate |
|
Confirm with a DEXA scan |
Every 6-12 months |
Clinical body composition scan |
Moderate |
Frequently Asked Questions About Metabolic Age for Athletes
Is a high metabolic age normal for athletes?
No. A high metabolic age is not normal for genuinely fit athletes. This result usually points to a scale error or RED-S rather than fitness level.
Does muscle mass always lower metabolic age?
Yes. Muscle mass lowers metabolic age in nearly every case, since muscle burns roughly three times more energy at rest than fat.
Can dehydration affect an athlete's metabolic age reading?
Yes. Dehydration can inflate a BIA-based metabolic age reading by making the device overestimate body fat percentage by up to 10%.
Should athletes use smart scales or DEXA scans?
DEXA scans give athletes the most accurate input for a metabolic age calculation. Smart scales in athlete mode work well for tracking trends between scans.
How often should athletes recheck their metabolic age?
Every 90 days. Muscle takes 8-12 weeks to measurably change Basal Metabolic Rate (BMR), so more frequent testing shows noise, not progress.
Your Next Step Toward an Accurate Score
Your metabolic age tells a different story than your training log, and that gap usually traces back to measurement method rather than actual health decline. Switch your device to athlete mode, add your body fat percentage, and test under the same fasted conditions every 90 days.
Body Mass Index (BMI) carries the same blind spot toward muscle, so pair your result with a BMI calculator tool to see the complete picture. Run your updated numbers today and compare your BMR, TDEE, and metabolic age score using the current Mifflin-St Jeor formula for 2026.