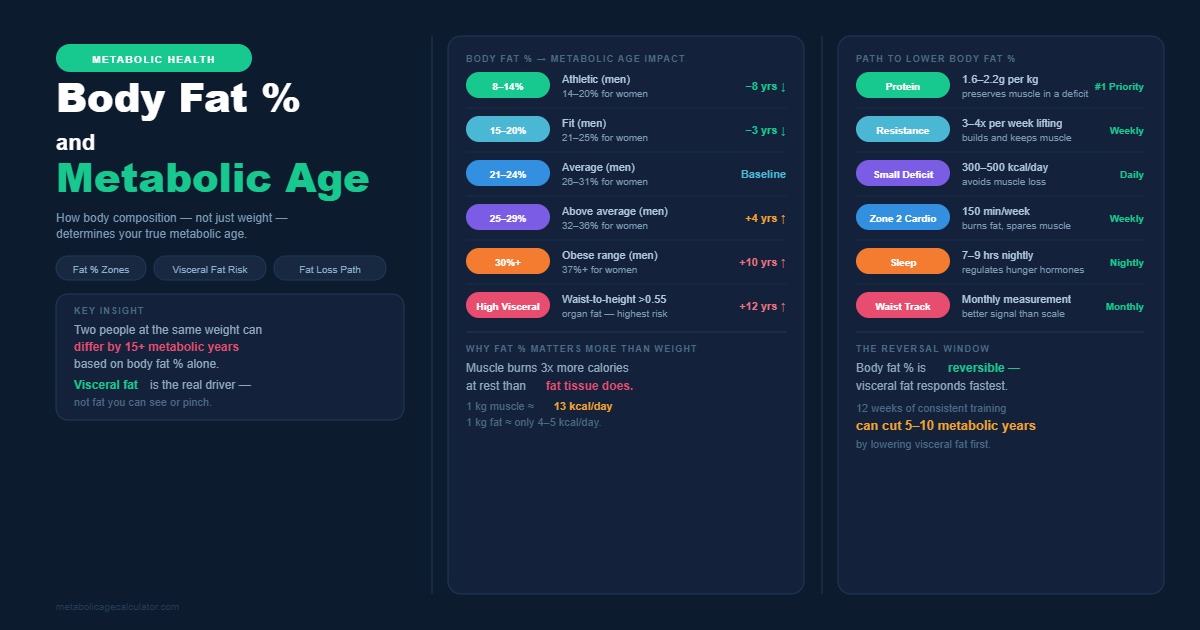
Body fat percentage drives your metabolic age more than total body weight does. Lean tissue burns far more resting calories than fat tissue, so your fat-to-muscle ratio decides how old your metabolism behaves.
Two people at the exact same weight can have post-metabolic ages 10 years apart, purely because of body composition, including fat mass, lean mass, and water weight. This guide gives you a body fat percentage chart by age, explains the Katch-McArdle formula, and lists 7 methods to lower your metabolic age this year.
Most scale-only trackers hide this relationship because a scale only reports total weight. It cannot separate the 3 tissue types that make up that number: fat mass, muscle mass, and water weight. Two clients can lose the exact same 10 lb (4.5 kg) and end the program with opposite metabolic outcomes. One client loses mostly fat and drops her metabolic age by 4 years. The other client loses mostly muscle through under-eating and raises his metabolic age by 3 years. Body fat percentage explains that gap; total weight cannot.
What Is the Real Link Between Body Fat Percentage and Metabolic Age?
Body fat percentage sets your resting calorie burn, because muscle tissue burns roughly 3 times more calories per hour at rest than fat tissue. Metabolic age compares your Basal Metabolic Rate (BMR) against average BMR data for your chronological age group. A lower body fat percentage at the same body weight produces a higher lean mass, and higher lean mass produces a higher BMR. That higher BMR then matches the average of a younger age bracket, which lowers your reported metabolic age.
How Lean Body Mass Changes Your BMR
Lean body mass (LBM) includes muscle, bone, organs, and water; it excludes fat tissue entirely. The Katch-McArdle formula calculates BMR directly from LBM: BMR = 370 + (21.6 x LBM in kg). Add 10 lb (4.5 kg) of muscle at 154 lb (70 kg) total weight, and your BMR climbs by roughly 90-100 calories per day. That single change can shift your metabolic age down by 3-5 years.
Fat tissue behaves differently inside the same formula. Fat cells burn roughly 2 calories per kg per day at rest, while muscle burns roughly 13 calories per kg per day. A 5% drop in body fat percentage, with weight held constant, typically adds 3-6 lb (1.4-2.7 kg) of lean mass. That shift alone can move your BMR up by 65-140 calories per day, depending on your starting weight.
Why Two People at the Same Weight Get Different Results
Take two 40-year-old women, both 154 lb (70 kg) and 5 ft 5 in (165 cm) tall. One carries 22% body fat; the other carries 35% body fat. The leaner woman holds roughly 120 lb (54 kg) of lean mass, versus 100 lb (45 kg) for the other woman. Her BMR runs about 190 calories higher per day, and her metabolic age lands 8-10 years below her chronological age. The higher-fat woman's metabolic age often sits 5-8 years above her real age.
What Is a Healthy Body Fat Percentage by Age in 2026?
A healthy body fat percentage ranges from 14% to 24% for men aged 20-39 and from 21% to 32% for women aged 20-39. Both ranges rise gradually by decade as muscle mass and hormone levels shift. Check the breakdowns below by gender, then verify your own number with a free body fat calculator.
Body Fat Percentage Ranges for Men by Decade
- Ages 20-29: essential 2-5%, athletic 6-13%, acceptable 14-24%, obese above 25%.
- Ages 40-49: essential 3-6%, athletic 7-15%, acceptable 16-26%, obese above 27%.
- Ages 60 and older: essential 4-8%, athletic 9-17%, acceptable 18-28%, obese above 29%.
Body Fat Percentage Ranges for Women by Decade
- Ages 20-29: essential 10-13%, athletic 14-20%, acceptable 21-31%, obese above 32%.
- Ages 40-49: essential 11-15%, athletic 16-22%, acceptable 23-33%, obese above 34%.
- Ages 60 and older: essential 13-17%, athletic 18-24%, acceptable 25-35%, obese above 36%.
How to Calculate Metabolic Age Using Body Fat Percentage
To calculate metabolic age using body fat percentage, you first find your lean body mass, then apply the Katch-McArdle formula, then compare the result to age-group BMR averages.
The Katch-McArdle Formula Explained
- Multiply body weight by (1 minus body fat percentage) to get lean mass.
- Multiply lean mass in kg by 21.6 and add 370 to get BMR.
- Compare that BMR figure to reference charts split by age and sex.
Example: a 35-year-old man weighing 180 lb (82 kg) at 20% body fat carries 144 lb (65 kg) of lean mass. His BMR equals 370 + (21.6 x 65), which is approximately 1,774 calories per day.
Comparing Katch-McArdle to Mifflin-St Jeor
The Mifflin-St Jeor equation uses weight and height only, without a body fat input, and holds accuracy within roughly 10%. The Katch-McArdle formula requires a body fat percentage and holds a mean bias closer to 1.5%. Choose Katch-McArdle whenever you already know your body fat percentage from a scale, calipers, or scan.
How Do Hormonal Changes Shift Body Fat Percentage and Metabolic Age?
Hormonal shifts change body fat percentage and metabolic age differently for men and women as you age. Both sexes see a gradual rise in fat mass and a gradual decline in muscle mass after age 30, but the timeline and triggers differ.
Female-Specific Changes After Age 35
- Ages 35-45: estrogen decline slows fat metabolism by up to 15%.
- Menopause: BMR can drop an additional 200-300 calories per day.
- Post-menopause: lower estrogen shifts fat storage toward the abdomen, raising visceral fat.
- Women carry 6-11% more essential body fat than men at every age bracket.
Male-Specific Changes After Age 30
- After age 30: testosterone declines roughly 1% per year, and BMR falls in parallel.
- After age 50: sarcopenia (age-related muscle loss) accelerates, cutting BMR by 1-2% per year.
- Men carry 30-40% more muscle mass than women on average.
- Muscle burns roughly 3 times more calories per hour at rest than fat tissue in both sexes.
Why Body Fat Percentage Predicts Health Risk Better Than BMI
Body fat percentage separates fat mass from muscle mass, while BMI cannot tell the two apart. A bodybuilder weighing 220 lb (100 kg) at 12% body fat can post the same BMI as a sedentary man at 220 lb with 30% body fat. Only body fat percentage flags the real metabolic risk in that comparison.
Visceral Fat vs Subcutaneous Fat
Subcutaneous fat sits directly under the skin and carries a lower health risk. Visceral fat wraps around internal organs, including the liver, pancreas, and intestines, and raises the risk of insulin resistance, high blood pressure, and type 2 diabetes. A higher visceral-to-subcutaneous ratio correlates with cardiometabolic disease, even inside a normal body fat range.
A DXA scan or CT scan separates the two fat types precisely, while a tape measure only estimates the total. A waist measurement above 40 in (102 cm) for men or 35 in (89 cm) for women signals elevated visceral fat risk. Reducing visceral fat by even 5-10% through diet and resistance training measurably lowers cardiometabolic risk markers.
How to Measure Body Fat Percentage Accurately
To measure body fat percentage accurately, choose from 6 established methods based on your budget and required precision. Accuracy ranges from within 1% for lab methods to within 3-8% for at-home tools. Test under the same conditions every time: fasted, hydrated, and at the same time of day. Dehydration alone can inflate a BIA fat reading by up to 10%.
- Bioelectrical Impedance Analysis (BIA): sends a low electrical current through your body; costs $30-$300 for a home scale.
- Skinfold calipers: pinch skin at 3-7 sites, including the chest, abdomen, and thigh; cost $10-$20.
- Dual-Energy X-ray Absorptiometry (DEXA): scans your full body with low-dose X-rays; costs $40-$150 per session.
- Hydrostatic weighing: submerges your full body in water to measure displacement; found mainly in university labs.
- Air displacement plethysmography (Bod Pod): measures air displacement inside a sealed chamber; costs $50-$75 per session.
- US Navy tape method: measures neck, waist, and hip circumference with a tape measure; free and requires no equipment.
For a fast estimate at home, use a free body fat calculator, which applies the Navy method automatically from 3 measurements.
How to Lower Your Metabolic Age by Reducing Fat Mass
To lower your metabolic age, you reduce fat mass while preserving or building lean mass, since lean tissue is what raises your BMR. The quick-reference table below lists 7 tasks, ranked by timing, method, and difficulty.
|
Task |
Timing |
Method |
Difficulty |
|
Strength training |
3-4x per week |
Compound lifts (squat, deadlift, bench press) |
Moderate |
|
Protein intake |
Daily |
0.7-1.0 g per lb (1.6-2.2 g per kg) of bodyweight |
Easy |
|
Sleep |
7-9 hours nightly |
Fixed bedtime, no screens 60 min before bed |
Easy |
|
HIIT sessions |
2x per week |
20-minute intervals (sprint, bike, rower) |
Moderate |
|
Calorie tracking |
Daily |
Log intake against a target deficit |
Easy |
|
Stress management |
Daily |
5-minute box breathing |
Easy |
|
Retesting |
Every 8-12 weeks |
Body fat calculator or DEXA scan |
Easy |
Resistance Training Targets
Add 3-4 full-body resistance sessions per week, using movements like squats, deadlifts, rows, and presses. Each added pound of muscle raises your BMR by roughly 6-10 calories per day at rest. Ten pounds (4.5 kg) of new muscle can raise your BMR by 60-100 calories daily.
Protein Intake and Sleep
Target 0.7-1.0 g of protein per lb of bodyweight (1.6-2.2 g per kg), since protein carries a thermic effect of 20-30%. Sleep 7-9 hours nightly, because 5 nights of 6-hour sleep can cut insulin sensitivity by 25%. Plan your macros with our macro calculator to hit your protein target without guesswork.
When Should You Retest Your Body Fat Percentage and Metabolic Age?
Retest your body fat percentage and metabolic age every 8-12 weeks, since muscle takes 8-12 weeks to measurably shift your BMR. Test at the same time of day, in a fasted and well-hydrated state, using the same method each time. Consistent testing conditions matter more than the specific method you choose.
Track 3 numbers at every retest: body fat percentage, waist circumference, and metabolic age. A metabolic age that drops while weight stays flat confirms muscle gain and fat loss happened together. A metabolic age that rises despite weight loss usually signals muscle loss, not fat loss, and calls for more protein and resistance training.
Frequently Asked Questions
Does body fat percentage affect metabolic age?
Yes. Body fat percentage directly changes your lean mass, and lean mass sets your BMR, which determines your metabolic age.
What is a healthy body fat percentage for my age?
Healthy ranges run from 14% to 28% for men and 21% to 35% for women, rising by roughly 1-2 percentage points per decade.
Can I lower my metabolic age without losing weight?
Yes. Building muscle while losing an equal amount of fat keeps your scale weight flat while raising your BMR and lowering your metabolic age.
Is BMI or body fat percentage more accurate for metabolic health?
Body fat percentage is more accurate, since BMI cannot distinguish muscle mass from fat mass at the same weight.
How often should I retest my body fat percentage?
Every 8-12 weeks, matching the time your body needs to build measurable muscle or lose measurable fat.
Final Takeaway on Body Fat Percentage and Metabolic Age
Your body fat percentage, not your bathroom scale, tells the real story behind your metabolic age. Track your fat mass, build lean muscle through resistance training, and retest every 8-12 weeks to watch your number drop. Start today with a calorie deficit calculator to build the plan that lowers both your fat mass and your metabolic age.